

In historical chart analysis, counting how often a number has appeared over a quarterly or annual window seems like straightforward arithmetic: count the occurrences, divide by the number of sessions, and calculate the frequency. However, this calculation is only as reliable as the continuity of the underlying timeline. When archive logs contain unrecorded dates, missing holiday records, or skipped operating sessions, the entire denominator shifts. An incomplete record does not merely omit data; it systematically corrupts relative frequencies, manufactures false absence streaks, and creates phantom trends out of empty space.
Whether researching historical records on the Sara777 Charts Portal or auditing external datasets, understanding how missing records distort frequency counts is an essential data literacy skill. This guide examines the mathematical mechanics of denominator corruption, the difference between random and systematic data loss, and why preserving explicit non-operating dates is vital for historical integrity.
The Denominator Problem: Total Days Versus Recorded Days
The foundation of empirical probability is the sample proportion:
Empirical Frequency = k (Observed Hits) ÷ N (Total Valid Trials)
When records go missing, both the numerator ($k$) and the denominator ($N$) become uncertain. Consider a concrete hypothetical example: tracking the single-digit 7 across a 90-day operating quarter where every single digit {0–9} has a uniform baseline probability of $1/10$ ($10.0\%$).
Suppose 90 actual draws took place, and digit 7 appeared exactly 9 times ($9 / 90 = 10.0\%$). Now observe what happens if an archive contains 18 missing dates due to transcription gaps, server outages, or dropped records:
| Archive Condition | Recorded Sessions ($N$) | Observed Hits ($k$) | Calculated Frequency | Distortion Effect |
|---|---|---|---|---|
| Complete Record | 90 sessions | 9 hits | 10.00% | Accurate baseline representation. |
| Missing Dates: Hits Preserved 18 missing dates were all non-7 draws |
72 sessions | 9 hits | 12.50% | +25.0% False Inflation Falsely looks like a “hot” digit. |
| Missing Dates: Proportional Loss 2 hits occurred on the 18 missing dates |
72 sessions | 7 hits | 9.72% | Slight statistical drift. |
| Missing Dates: Hits Concentrated in Gaps 4 hits occurred on the 18 missing dates |
72 sessions | 5 hits | 6.94% | -30.6% False Suppression Falsely looks like an “overdue” digit. |
In the third scenario, a digit that appeared with textbook 10% frequency in physical reality is recorded at only 6.94% simply because several of its appearances occurred during unrecorded sessions. An analyst reviewing this damaged ledger might conclude that digit 7 has experienced an extraordinary cold spell, when the deficit was created entirely by broken bookkeeping.
Gap and Streak Distortion: Manufacturing Phantom Anomalies
Beyond overall percentage counts, chart readers frequently track recurrence intervals—the number of draws that elapse between appearances of a specific number.
In an independent draw mechanism where $p = 0.10$, the expected recurrence gap between occurrences of any single digit follows a geometric distribution with a mean of $1 / p = 10$ draws.
When days are missing from an archive, recurrence interval calculations suffer from two severe mathematical distortions:
1. Artificial Droughts (Type I Error)
Suppose digit 4 appeared on Day 12, appeared again on Day 24, and appeared again on Day 40. The actual intervals were 12 draws and 16 draws—both well within normal statistical variance.
If the archive fails to record the results between Day 20 and Day 30, the hit on Day 24 vanishes from the record. An analyst examining the surviving data connects Day 12 directly to Day 40, recording an apparent gap of 28 draws. This manufactures the false impression that digit 4 suffered an extreme absence streak, triggering the Gambler's Fallacy examined in our analysis of when a number is called due.
2. Compressed Time (Type II Error)
Conversely, if missing dates are silently excised without preserving placeholder markers, adjacent calendar records are stitched together as if they occurred on consecutive days. A digit that appeared on a Friday and not again until the following Thursday might appear in a corrupted log as having a 2-draw gap instead of a 6-draw gap, artificially inflating perceived clustering.
Systematic Versus Random Missingness: The MAR and MNAR Trap
In statistical theory, missing data is classified into three categories:
- Missing Completely at Random (MCAR): The probability that a record is missing is completely unrelated to any variable, observed or unobserved (e.g., an occasional random network timeout).
- Missing at Random (MAR): Missingness depends systematically on an observed variable (e.g., an automated archiving script that regularly fails on Sundays due to distinct weekend server maintenance).
- Missing Not at Random (MNAR): Missingness depends directly on the unobserved result itself (e.g., an informal reporting desk failing to post charts during chaotic market sessions, sudden draw cancellations, or disputes).
In historical Matka archives, missing records are almost never completely random. They frequently correlate with:
- Day-of-the-Week Skew: Many historical markets operated on 5-day or 6-day schedules. If an analyst treats a 5-day market as a 7-day calendar series, weekend dates appear as missing data, distorting weekly cycle analyses.
- Festival and Public Holidays: Major observances (such as Diwali or Holi) often see market closures. If holidays are omitted from the archive without explicit notation, monthly volume counts become skewed.
- Historical Transition Periods: When older paper ledgers were first digitized in the early 2000s, certain months or seasonal quarters suffered higher loss rates than others. Calculating year-over-year frequency comparisons without adjusting for varying data completeness produces meaningless trends.
The Imputation Hazard: Confusing Empty Data with Numerical Zero
In spreadsheet analysis and database queries, an empty cell or `NULL` value is frequently mishandled. When an analyst runs automated counting functions:
- Some spreadsheet formulas treat blank cells as
0, inadvertently inflating the historical frequency of the digit 0. - Summation and averaging formulas that treat missing days as
0drag down statistical means, distorting the standard deviation and variance of the dataset.
The Three Fundamental Data States
Rigorous archive architecture requires distinguishing between three distinct operational states:
1. Result Declared: A valid draw occurred and the result was recorded (e.g., 358-6).
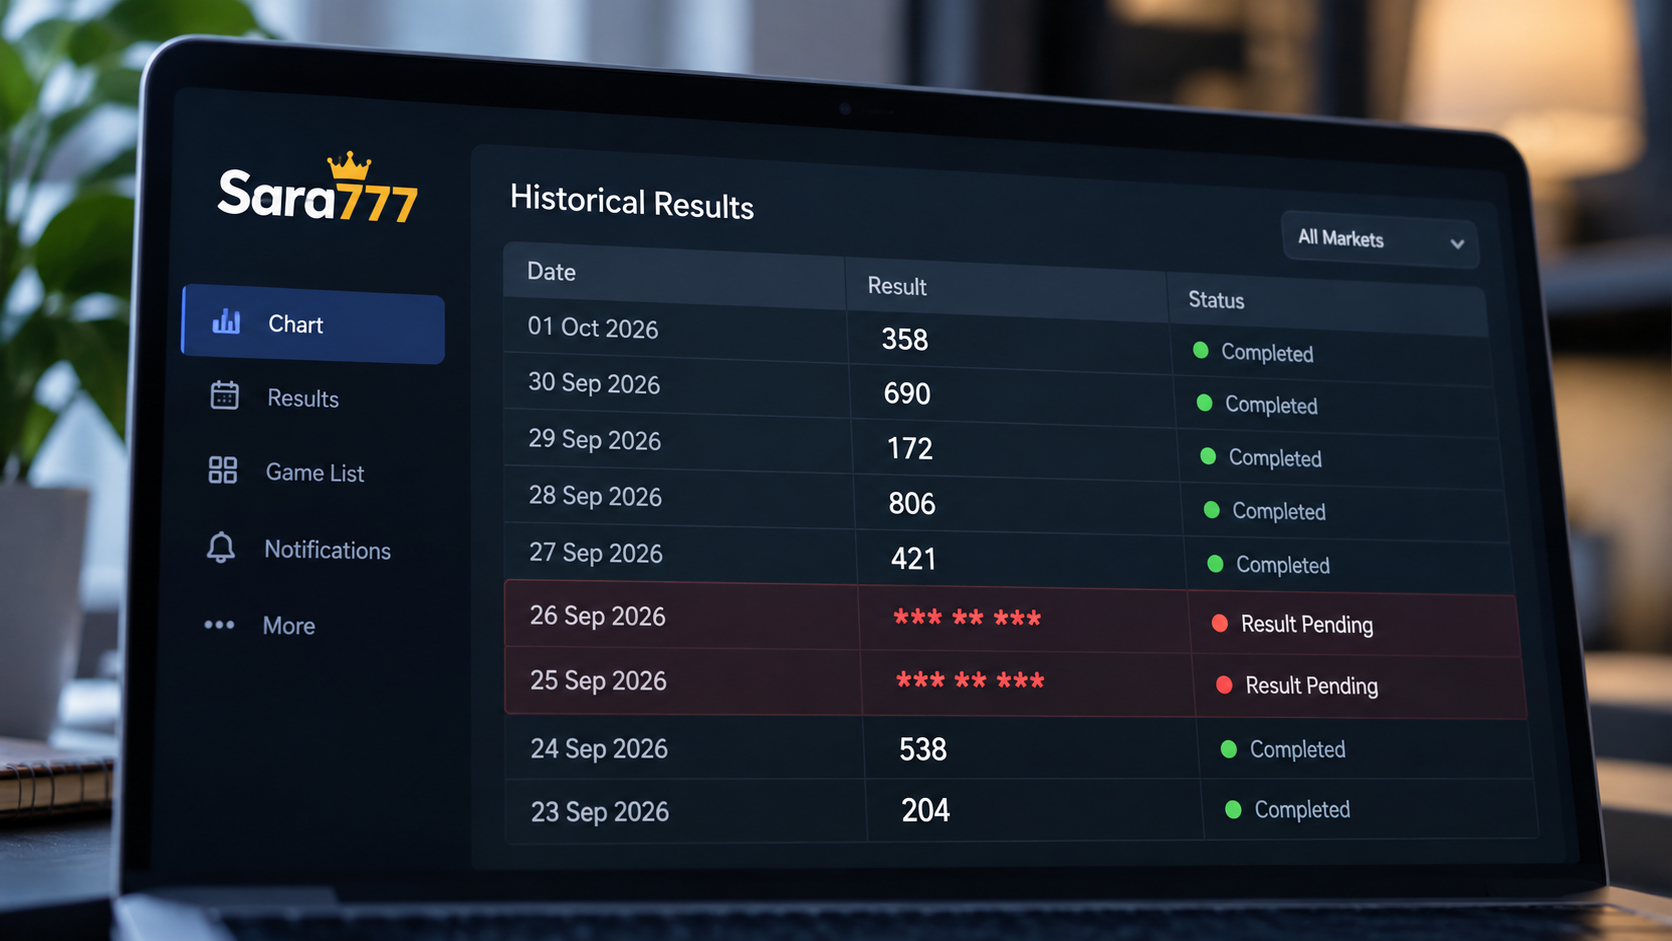
2. Scheduled Non-Operating Day: The market was officially closed for a weekly off-day or holiday (e.g., *** ** ***).
3. Unrecorded / Missing Record: A draw was scheduled to occur, but the outcome was not captured or verified (marked explicitly as NULL / Pending).
Conflating State 2 (a known non-event) with State 3 (an unobserved event) corrupts both the denominator and the theoretical expectation of the series.
Cross-Market Comparisons: The Baseline Normalization Requirement
Another common analytical error occurs when comparing raw hit counts across different markets.
Consider an analyst comparing the performance of Jodi 45 across two prominent markets over a single calendar year:
- Market A: Operates 6 days a week, with a nearly complete archive of 310 recorded sessions. Jodi
45appeared 4 times. - Market B: Operates 5 days a week and suffered multiple missing records, leaving only 235 recorded sessions. Jodi
45appeared 3 times.
If an analyst looks only at raw counts, they might claim Jodi 45 was “hotter” in Market A (4 hits vs. 3 hits). However, calculating the relative proportions reveals the opposite:
Market A Frequency = 4 ÷ 310 = 1.29%
Market B Frequency = 3 ÷ 235 = 1.28%
Despite the difference in raw hit counts, the empirical frequency between the two markets is virtually identical once normalized by verified sessions.
Without normalizing by the verified denominator, comparing raw counts across archives with differing data completeness is mathematically invalid.
How Sara777 Maintains Historical Archive Integrity
To protect historical datasets from denominator corruption and artificial gaps, modern data platforms enforce strict structural rules:
- Continuous Calendar Indexing: Every calendar date is preserved as an explicit row in the database, ensuring that skipped dates cannot silently disappear from view.
- Explicit Status Indicators: As shown in our historical results dashboard, sessions that have not yet occurred or are undergoing verification are clearly marked with pending status indicators rather than blank cells.
- Full Pana Preservation: In addition to two-digit Jodi numbers, complete three-digit Pana declarations are maintained to preserve the underlying combinatorial structure, as detailed in our guide on what a full Pana record preserves.
Conclusion: The First Rule of Frequency Analysis
Before calculating any frequency percentage, measuring absence streaks, or evaluating historical claims, an analyst must first audit the continuity of the dates. An archive with missing entries produces illusory patterns that reflect errors in record collection rather than the properties of the random draw. In data analysis, the integrity of the denominator is just as important as the accuracy of the numerator.