

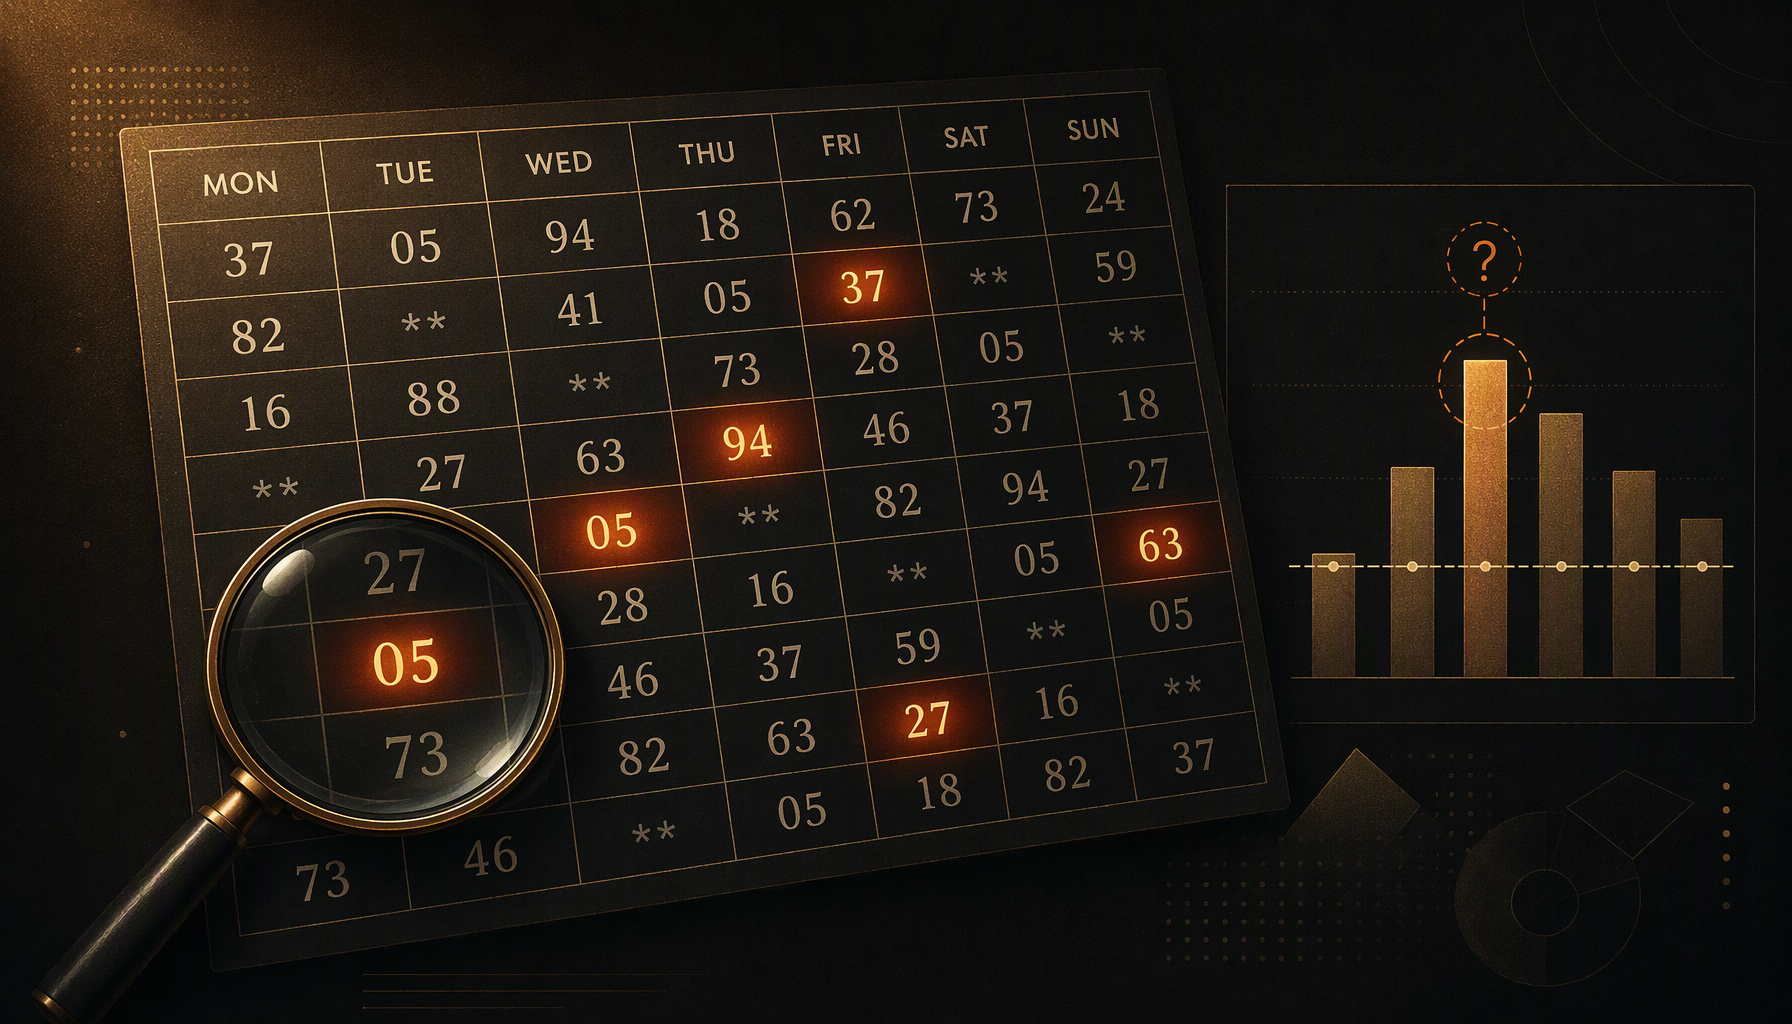
A Kalyan chart records what has already been declared; it does not narrow down what will be declared next. Legitimate chart analysis means one specific thing: choose your counting window before you look at the grid, count how often an outcome actually appears inside it, and compare that count to the base rate the game defines. For a single jodi that base rate is 1 in 100 — about 10 appearances per 1,000 declared draws, with anything from roughly 4 to 16 considered ordinary variation. And here is the part most "pattern" posts leave out: across a hundred jodis, chance alone guarantees that two or three of them will look hot and about one will look cold, whether or not anything real is going on.
Descriptive, not predictive. Everything in this guide describes an archive of past results. Nothing here is a forecasting method, and a frequency count that looks unusual is far more likely to be ordinary statistical noise than a signal. If a number is at stake, the honest position is that the next Kalyan jodi is as uncertain as the first one was.
Which Kalyan Chart? Three Markets Carry That Name
Before any counting, pin down the market. The platform's own market list defines three separate entries whose names begin with Kalyan: Kalyan (a Main market, open session 16:10 and close session 18:10 IST), Kalyan Night (also Main, 21:20 and 23:20 IST) and Kalyan Starline (a Starline market, 10:00 and 11:00 IST). Each is a distinct record. The chart route resolves one market at a time, and every query behind it filters by that market's own identifier — so the Kalyan grid never mixes in Kalyan Night rows, and neither grid has anything to do with Starline.
Two consequences for analysis. First, a count you took off one chart is only valid for that chart; moving a "finding" from Kalyan to Kalyan Night is not extending a pattern, it is abandoning your sample. Second, Starline is a different game structure entirely — its bet types are Single, Double and Triple Panna with no Jodi market and no Open/Close pairing in the Main sense — so there is no Starline jodi column to count. If you want to know which of the two charts you should actually be reading, the Jodi chart versus Pana chart comparison settles that question; this guide assumes you are on the Jodi grid.
How the Weekly Grid Is Assembled
"Pattern" claims go wrong at the structural level more often than the mathematical one, so it is worth knowing exactly how the table you are reading is produced.
- The source window is three years, rolling. The chart request pulls dated market rows from today back to today minus three years. Because "today" moves, the oldest week quietly drops off the top of the grid every day — your counts change even on days when nothing new was declared.
- Only rows with a declared digit are fetched. A market day qualifies for the chart only if at least one of its two sessions already carries a first digit. Days that exist as calendar entries but have no result are not sent to the page at all.
- Days are grouped into calendar weeks anchored on Monday. The grouping is not "the last seven draws"; it is the Monday-to-Sunday block each date falls in. Rows are then laid out chronologically, oldest week at the top, newest week at the bottom of the table.
- Each result sits in its real weekday column. A Monday result always lands under MON. A week with three missing days therefore keeps its gaps in place rather than compacting leftward.
- The newest week is incomplete by design. The page marks the last row as the latest entry, which is useful for navigation but dangerous for counting — that row may hold one day or seven.
- Two caches sit between the draw and your screen. The chart response tells the browser to reuse its copy for 60 seconds, and the server holds its own assembled chart data for up to ten minutes. A result declared two minutes ago may legitimately be absent.
What Each Jodi Cell Can Hold — Including One Trap
A cell is built from two digits: the open session's Ank first, then the close session's Ank. The open digit gates the whole cell, which produces an asymmetry that surprises most readers.
| Cell shows | What is actually true behind it |
|---|---|
37 |
Both sessions are declared. The jodi is complete and eligible for red styling. |
3* |
The open Ank exists; the close session has not been published yet. |
** |
The open Ank is missing. This covers a day that has no record at all, a day waiting on its open draw — and a day where the close session has already been published but the open has not. On this grid those three look identical. |
Three practical read-offs. A cell containing a star can never be shown in red, because the red rule only applies once both digits exist. Any close-session frequency you try to measure from the Jodi grid is silently under-counted — the close Ank is hidden whenever the open Ank is absent, so that particular count belongs on the Pana chart. And before you treat an empty cell as a data-quality complaint, read the guide on what the asterisk placeholders mean, which separates a pending session from a market holiday from a date older than the platform's records.
The Base Rates Every Kalyan Count Is Measured Against
A count is meaningless on its own; it only means something next to the number you would expect from pure chance. That expected number is easy to state because the structure is simple: the jodi is one digit from the open draw and one from the close draw, each Ank being the digit-sum of a three-digit pana reduced modulo 10. Every Ank digit 0 through 9 arises from exactly 100 of the 1,000 possible ordered pana digits, so the ten digits are equally likely, and the 100 two-digit combinations are equally likely across the full set. For the combination maths behind the pana themselves, the derivation of the 220 patti count covers it properly.
| Outcome you might count | Share of declared draws | Expected count per 1,000 draws | Still-ordinary range |
|---|---|---|---|
| One specific jodi, e.g. 37 | 1 in 100 | 10 | roughly 4 to 16 |
| Any red jodi | 20 in 100 | 200 | roughly 175 to 225 |
| One specific open Ank digit | 1 in 10 | 100 | roughly 81 to 119 |
| One specific three-digit open pana | 1 in 1,000 | 1 | 0 to 3 |
The red total is exactly twenty because the rule catches two disjoint shapes: the ten doubles (00, 11, 22 … 99) and the ten pairs whose digits differ by five (05, 16, 27, 38, 49, 50, 61, 72, 83, 94). Count them once and you never have to argue about whether a given jodi should have been highlighted — see the Kalyan jodi chart guide for how the chart presents them.
The "still-ordinary range" is a 95 percent variation band for a count drawn from 1,000 independent draws. It is not a special Matka concept; it is the standard arithmetic of sampling. Its only job here is to stop you from being impressed.
Hot and Cold Numbers Exist Before You Look
This is the single most important idea in chart analysis, and it costs nothing to state. If you flip through a Kalyan grid covering roughly 1,000 declared draws and tally all hundred jodis, chance alone puts about 2 or 3 of them at 17 or more appearances and about 1 of them at 3 or fewer. Those extremes are not discoveries; they are the guaranteed shape of a hundred simultaneous coin-flip-like counts. The correct sequence is: expect the spread, then ask whether anything exceeds it — never the other way around.
Fix the Window Before You Count Anything
A reusable method matters more than any individual number, because the failure mode of chart reading is not stupidity but free choice of window. Sliding your start date until a number looks unusual is the single easiest way to manufacture a false finding, and it is effortless to do by accident.
| Decide this first | What to write down |
|---|---|
| Window | A set number of complete weeks, e.g. the 48 Monday-to-Sunday rows above the current one. Exclude the bottom row. |
| Denominator | The number of cells that actually hold a full two-digit jodi — not the number of rows, and not 7 × weeks. |
| Outcome | One target chosen in advance: a specific jodi, the red class, or one Ank digit. |
| Expectation | Base rate × your denominator, plus the band around it. |
| Verdict | Inside the band, above it, below it. If you re-window, mark the earlier count discarded. |
Over a 48-complete-week window with roughly 336 filled cells, one specific jodi is expected about 3.4 times — and a result anywhere from 0 to 7 is unremarkable. That is the honest scale of what you can conclude from a year of a daily market. Small windows cannot detect anything, and a single market year is a small window.
Gap Arithmetic: Why a Number Is Never "Due"
Waiting-for-a-due-number is the most common reading of a weekly grid, and the arithmetic defeats it directly. For one chosen jodi and a seven-draw week, the chance it appears at least once that week is about 6.8 percent. That implies an average wait of roughly 15 weeks between appearances. From the same arithmetic:
- An eight-week absence for a given jodi happens in roughly 57 percent of such stretches — it is the normal case, not an anomaly.
- A twelve-week absence still occurs about 43 percent of the time.
- Across a full 48-week year, the same jodi shows up at least once about 97 percent of the time — which is another way of saying a chart of reasonable length contains almost no jodis that never appear.
There is also no mechanism by which the chart could remember. Each declared result belongs to one dated market day, and nothing in the settlement path reads a previous day's digits when producing the next one. The distribution has no state, so a long run without 37 does not raise tomorrow's chance of 37 — it only lengthens the streak you are already watching. The reason "never seen" cells appear at all is usually the denominator problem above plus genuine archive gaps, not an unbroken drought.
What the Grid Can Genuinely Tell You
Stripping out prediction leaves a real, useful list — and it is mostly about the record, not the numbers.
- Schedule coverage. Which weeks have no row at all, and which weekday columns are persistently empty, tells you when the market was running. That is worth knowing before you trust any count on the page.
- Live session state. A
3*cell is a truthful statement that the close draw is still pending, which is exactly the information a player checking their own ticket needs. - Verification against memory. The search box does a substring match on each cell's code, highlights every match at once and jumps to the first. Ticking off whether "that number came twice last month" is a legitimate use — just remember it only sees two-character codes, so a three-digit query returns nothing on this grid.
- Descriptive frequency, bounded by the band. "Red jodis filled 19 percent of the cells in these 48 weeks" is a fair sentence. "Red is due to cool off" is not.
- The reach of the archive. Nothing older than roughly three years is on the page, so "this has never happened" always means "has not happened inside the window this chart shows".
Five Mistakes That Make a Chart Look Predictive
Counting rows instead of declared cells
Weeks and rows are calendar containers, not samples. Your denominator is the number of cells holding a real two-digit jodi; anything else inflates or deflates every rate you compute.
Sliding the window until something appears
With 100 outcomes and an arbitrary start date, an "unusual" number is guaranteed to surface. Fix the window in advance and treat a re-window as a new experiment.
Reading the newest row as finished
The bottom week is mid-flight, and the caching delay means even a declared result may not be visible yet. Compare complete weeks only.
Treating a blank as a zero
** is absence of information, not an outcome. It hides close-only days, pending days and historic gaps in one identical glyph.
Turning a frequency into tomorrow's probability
Equal base rates and independent draws mean a past count carries no forward information. The moment a count starts informing a stake, it has stopped being analysis.
Frequently Asked Questions
How many weeks of Kalyan chart should I analyse?
As many complete weeks as the page gives you, minus the current one — and expect that even a full year supports almost no conclusion. A 48-week window is roughly 336 declared jodis; the difference between "hot" and ordinary there is a couple of appearances.
Why does my count disagree with someone else's from the same chart?
Almost always a different denominator: rows versus filled cells, including versus excluding the incomplete bottom week, or a different start date in a rolling three-year window. Agree on those three before comparing numbers.
Is a jodi that repeats in the same week meaningful?
Within a seven-draw week the chance that one specific jodi appears at all is under 7 percent, and repeats inside that week are rarer still — which is exactly why one observed repeat is a coincidence worth noticing and not a pattern worth acting on.
Can I predict the close Ank from the open Ank shown as 3*?
No. The two sessions are separate draws and the grid simply displays one as soon as it exists. The partial cell tells you the open is declared and the close is not; it carries no information about the close digit.
Should Starline results be counted with Kalyan because one is named Kalyan Starline?
No. It is a separate market with a separate structure and no Jodi pairing at all. Mixing them corrupts both counts.
The Honest Use of a Kalyan Chart
Read well, the weekly grid is a ledger: it shows what was declared, when the market actually ran, and how often each outcome has appeared against a base rate you can write down in advance. Read badly, it is a machine for producing confidence that the next draw is friendlier than it is. If you keep the two apart, the chart earns its place — and if the counting starts steering stake sizes rather than record-keeping, the responsible-play guidance in our safety and security rules is the more useful read.