

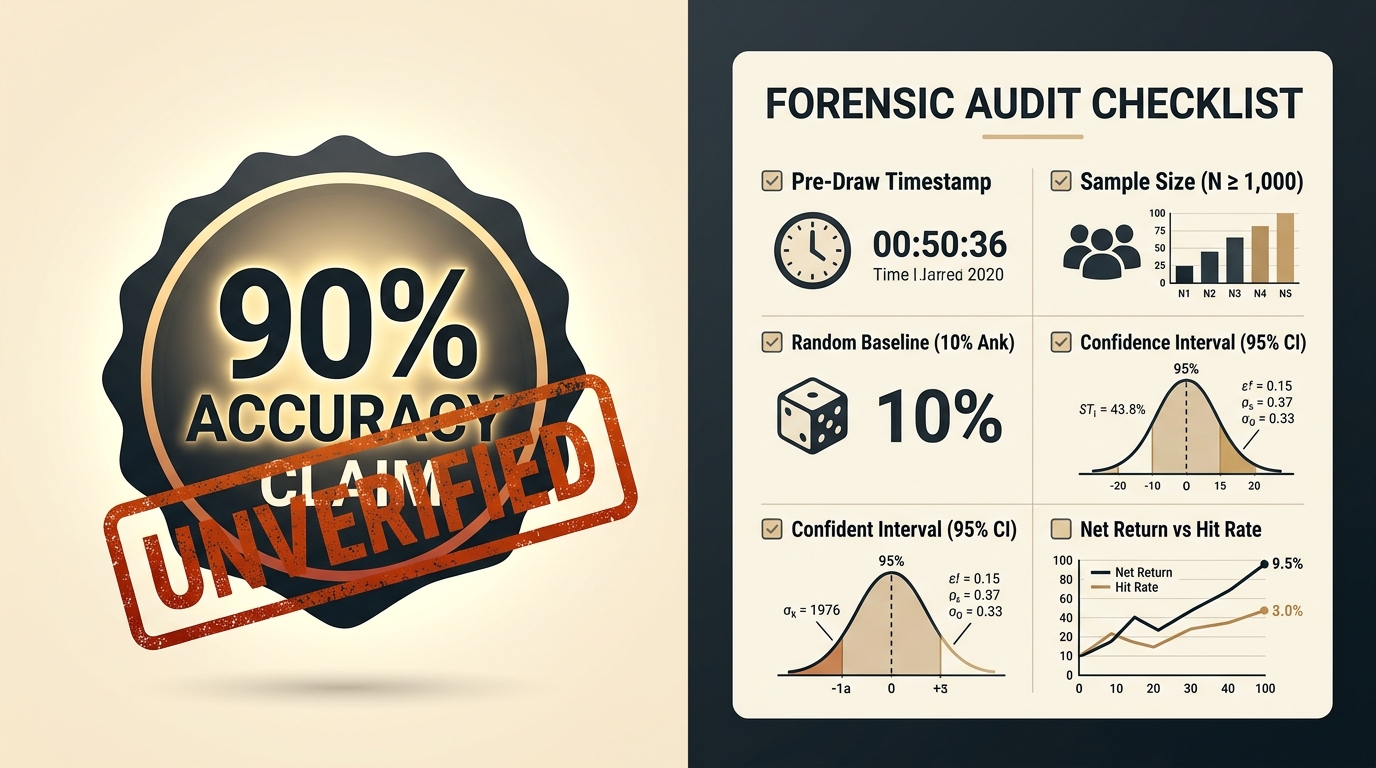
Across informal Matka forums and messaging channels, claims promising “90% accuracy,” “sure-shot guessing,” or “fixed open-to-close formulas” circulate routinely. Yet in quantitative analysis, an accuracy percentage is meaningless in isolation. Without a pre-registered timestamp, a defined sample size, an unambiguous target definition, and a comparison against the underlying combinatorial baseline, any accuracy figure can be manufactured through statistical sleight of hand. This guide outlines an eight-point verification framework that any forecasting claim must satisfy before it can be treated as mathematically valid.
This analysis is not an endorsement of any forecasting service, nor does it present evidence that 90% accuracy is achievable in independent number draws. Rather, it functions as an audit standard. Just as financial analysts audit performance claims against rigorous benchmark criteria, readers reviewing Matka claims must understand the statistical requirements that separate genuine evidence from promotional fiction.
The 8-Point Verification Checklist
Before an accuracy figure can be taken seriously by any statistician or analyst, it must withstand scrutiny across eight specific dimensions:
| Audit Criterion | What Unverified Claims Typically Do | What Strict Verification Requires |
|---|---|---|
| 1. Prediction Timestamp | Shared in editable channels or posted after market cutoff. | Cryptographically locked or third-party timestamped strictly prior to draw close. |
| 2. Target Unambiguity | Provides 4 digits, cut numbers, or Pana families, claiming success if any digit hits. | Exact single candidate designated upfront, or full candidate set factored into baseline probability. |
| 3. Sample Size (Denominator) | Cites a 7-day or 10-draw winning run (e.g., 9 out of 10). | A continuous sample of hundreds or thousands of draws ($N \ge 1{,}000$) with narrow confidence intervals. |
| 4. Continuous Timeline | Omits losing weeks, failed declarations, or holiday gaps. | Unbroken chronological ledger with every single market session accounted for. |
| 5. Independent Ledger | Self-reported screenshots or editable social media feeds. | Immutable third-party registry where logs cannot be retroactively edited or deleted. |
| 6. Prospective Testing | Backfits formulas onto past historical charts after results are known. | Out-of-sample forward testing conducted exclusively on future, unseen draws. |
| 7. Baseline Comparison | Ignores random chance, treating a 40% random hit set as an achievement. | Calculated $p$-value tested against the null hypothesis of pure combinatorial randomness. |
| 8. Profitability vs Hit Rate | Equates a high hit rate with financial profit while ignoring total stake costs. | Explicit net expected value calculation incorporating stake volume and bookmaker payouts. |
1. Precisely Defined Predictions and Timestamps
The first prerequisite of any scientific or statistical verification is that the forecast must be committed in an unalterable format before the event occurs.
In promotional messaging, predictions are frequently phrased with deliberate ambiguity. A tipster might announce: “Today Kalyan Open: 3 or 8, support digits 2, 7, with family Pana.” If 8 appears as the Open digit, they declare a 100% successful hit. If 2 appears, they point to their “support” selection. If 7 appears as the Close digit hours later, they claim their forecast covered the whole day.
This practice is known as goalpost shifting. A verified test requires a single, mutually exclusive operational rule defined in advance:
- Exactly which market session is being predicted (e.g., Kalyan Open on a specific calendar date).
- The exact numbers included in the prediction set.
- A hard cutoff timestamp verifying the entry was recorded before market books closed.
- A strict declaration that any outcome outside the designated candidate set is scored as an unequivocal failure.
2. Success Criteria and Baseline Probability
A percentage hit rate has no scientific meaning without comparing it directly to the random baseline probability of the target set. Consider the three main bet formats in a standard Matka session:
- Single Ank (Digit 0–9): A single digit selection has a base random chance of 1 in 10 (10.0%).
- Jodi (Two Digits 00–99): A specific pair selection has a base random chance of 1 in 100 (1.0%).
- Single Pana (Patti): Selecting one specific Patti out of 220 total combinations has a base chance of 1 in 220 (approx. 0.455%).
When a claimant boasts “90% accuracy,” what are they actually predicting?
The Inflated Baseline Illusion
If a tipster provides 4 digits for the Open and another 4 digits for the Close, claiming a win if any one digit hits across either session, the probability of at least one hit by pure chance is not 10%. The probability of missing all 4 digits on Open is $(6/10) = 60\%$, and missing both Open and Close is $(0.60 \times 0.60) = 36\%$. Therefore, pure random chance yields a hit rate of 64.0%!
Achieving an 80% or 90% hit rate when your baseline random chance is already 64% represents only a modest departure from coin-flipping, whereas claiming 90% accuracy on a single 1-in-100 Jodi would represent a 90-fold multiplier over physical reality. Without specifying the baseline, the raw accuracy percentage is completely deceptive.
3. The Denominator Problem: Sample Size and Confidence Intervals
The most common tactic used to fabricate a 90% claim is the small-sample streak. A tipster highlights a period where 9 out of 10 consecutive daily draws matched their predictions ($9 / 10 = 90\%$).
In statistical inference, a sample of 10 trials ($N = 10$) carries an enormous margin of error. Using standard binomial distribution analysis, we can calculate the 95% Confidence Interval (CI) for 90% observed success across different sample sizes:
| Sample Size ($N$) | Observed Hits | Observed Accuracy | 95% Confidence Interval (Clopper-Pearson) | Statistical Reality |
|---|---|---|---|---|
| 10 draws | 9 hits | 90.0% | 55.5% to 99.7% | Virtually uninformative; indistinguishable from random luck. |
| 50 draws | 45 hits | 90.0% | 78.2% to 96.7% | Moderate variance; still sensitive to short-term clustering. |
| 250 draws | 225 hits | 90.0% | 85.6% to 93.4% | Meaningful sample spanning roughly one calendar year. |
| 1,000 draws | 900 hits | 90.0% | 88.0% to 91.8% | Rigorous sample providing narrow, statistically reliable bounds. |
As the table demonstrates, observing 9 hits out of 10 trials yields a confidence interval whose lower bound drops down to 55.5%. A sample of 10 draws is simply too small to verify any long-term capability. To verify a 90% claim with statistical confidence, the record must document hundreds of consecutive prospective trials.
4. Prospective Forward Testing Versus Retrospective Curve-Fitting
There is a critical distinction in empirical science between in-sample fitting and out-of-sample testing:
- Retrospective Backfitting (In-Sample): Looking backward at historical charts—such as the Kalyan Jodi Chart or Kalyan Pana Chart—and formulating an algebraic rule that successfully matches 90% of past results. Because past results are already fixed and known, a sufficiently complex formula can always be fine-tuned to fit historical data with near-perfect accuracy.
- Prospective Forward Testing (Out-of-Sample): Locking the formula in advance and applying it strictly to future, unknown draws that have not yet occurred.
Almost every “90% system” presented online was created through retrospective curve-fitting. The moment those exact same rules are tested prospectively against future draws, their predictive accuracy collapses back to the baseline of random chance.
5. Survivorship Bias and the File-Drawer Problem
Even when an individual observer witnesses a tipster achieve 9 out of 10 hits in real time, that observation may be an artifact of survivorship bias.
Imagine 1,024 different automated tipsters or forum accounts making independent guesses on single-digit outcomes every day. Purely by the laws of probability, the distribution of random streaks will sort these accounts:
- On Day 1, roughly half the accounts guess correctly on binary choices.
- By Day 7, approximately 8 accounts will have achieved an unbroken streak of 7 correct calls purely by chance ($1{,}024 / 2^7 = 8$).
- By Day 10, one or two accounts will have achieved a 9-out-of-10 or 10-out-of-10 record without possessing any predictive insight whatsoever.
The 1,022 accounts that failed are quietly abandoned or deleted (the file-drawer effect), while the single surviving account proclaims: “Verified 90% Accuracy Over 10 Days!” Unless an auditor tracks the entire denominator of attempts—including all failed accounts and prior abandoned runs—a surviving hot streak proves nothing about future accuracy.
6. The Profitability Paradox: Why 90% Accuracy Can Still Lose Money
Perhaps the most widespread misconception among wagering audiences is the assumption that a high hit rate automatically guarantees financial profit. In mathematics, hit rate and expected return are two entirely separate metrics.
Consider how Matka payouts function in practice. Under standard market payout conventions—analyzed thoroughly in our guide to rate, stake, payout, and net return—a standard single-digit (Ank) wager typically pays 10 ka 95 (returning ₹95 on a successful ₹10 stake, representing a $9.5\times$ gross return).
Now suppose a guessing system achieves an undisputed 90% hit rate by playing 9 out of the 10 available single digits on every draw:
| Draw Scenario | Probability | Total Stake (₹10 on 9 digits) | Gross Payout | Net Financial Outcome |
|---|---|---|---|---|
| Winning Draw (1 of 9 hits) | 90.0% (0.90) | ₹90.00 | ₹95.00 | +₹5.00 Profit |
| Losing Draw (10th digit hits) | 10.0% (0.10) | ₹90.00 | ₹0.00 | -₹90.00 Loss |
We can now calculate the exact mathematical expected value ($EV$) per draw:
Expected Return = (0.90 × +₹5.00) + (0.10 × -₹90.00)
Expected Return = +₹4.50 - ₹9.00 = -₹4.50 per draw
Net Return on Stake: -₹4.50 ÷ ₹90.00 = -5.0%
The result is mathematically unequivocal: despite maintaining a genuine, verified 90% accuracy rate, the player is mathematically locked into losing 5% of every rupee staked over time. When a single loss wipes out the modest profits of eighteen consecutive wins, a 90% hit rate produces guaranteed long-term financial insolvency.
7. How to Evaluate Any Accuracy Claim: Practical Questions
When confronted with any promotional claim asserting high predictive accuracy, readers should ask five direct verification questions:
- Where is the immutable pre-draw timestamp? Is the prediction recorded in an uneditable public registry before books closed, or was it posted in an editable chat message?
- What is the exact denominator? How many consecutive sessions have been logged without interruption? If the count is fewer than several hundred draws, the sample size is statistically inadequate.
- How many numbers make up the prediction set? If multiple digits or support options are given, what is the combined random baseline probability of the set?
- Were losing days included? Does the record show an unbroken calendar sequence, or are there convenient date gaps following known market misses?
- What is the net financial return after stake deduction? If you stake the required capital across all suggested numbers under published payout rates, does the arithmetic produce a positive expectation or a negative drain?
Conclusion: Separating Verified Records From Speculative Noise
The historical tables maintained on the Sara777 Charts Portal exist to preserve transparent, verifiable records of what actually transpired in past draws. They provide a reliable audit trail for settlement verification, as discussed in our study on what a full Pana record preserves and the mathematical nature of independent draws in when a number is called due.
A mathematical audit of forecasting claims demonstrates that 90% accuracy is either an artifact of small-sample variance, an inflated baseline covering most of the board, an in-sample curve fit, or an asymmetric wagering strategy that loses money over time. Requiring strict proof—including unalterable timestamps, large prospective samples, and net return calculations—is the only way to evaluate predictive assertions objectively.